

What is the problem, exactly?
Payment interactions in closely-knit communities often involve cycles. e.g.
AlicepaysBob$100BobpaysCharlie$80CharliepaysAlice$70
Total liquidity used for settlement: $100 + $80 + $70 = $250
When these payments involve credit (e.g. IOUs/obligations) such cycles can be cleared and the payments can be settled with lesser liquidity. That is why such mechanisms are known as liquidity-saving mechanisms (LSMs). e.g.
AliceowesBob$100BobowesCharlie$80CharlieowesAlice$70
If we clear the $70 cycle between them, this can be settled as →
AlicepaysBob$30BobpaysCharlie$10
Total liquidity used for settlement: $30 + $10 = $40
Liquidity saved: $250 - $40 = $210
Note the preconditions for this to work →
- Closely-knit communities with lots of obligations as that increases the chances of having cycles.
- Some form of deferred payments (based on credit).
But to be able to do this at a national or international level, we would have to find cycles in a network of enormous proportions - think Splitwise but for tens of millions of people.
Is finding cycles in a large payment network our problem?
Let’s look at a slightly more complex example →
AliceowesBob$100BobowesEve$70EveowesAlice$100CharlieowesDave$100DaveowesEve$100EveowesCharlie$70BobowesCharlie$100
It is obvious that there are two $70 cycles here →
AliceowesBobowesEveowesAliceCharlieowesDaveowesEveowesCharlie
But look closely, there's also a $100 cycle →
AliceowesBobowesCharlieowesDaveowesEveowesAlice
So clearly there are multiple solutions to this cycle-finding problem!
Depending on the set of cycles we choose to clear we would end up with different amounts of liquidity saved (i.e. $420 v/s $500).
Designing a solution
Let’s first try to visualconsole.log()ize the network as that could give us some intuition for how to approach the problem.
Visualizing the obligation network as a graph
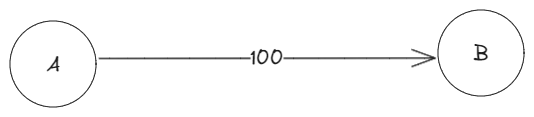
A single obligation can be expressed as Alice owes $100 to Bob →
| Debtor | Creditor | Amount |
|---|---|---|
Alice | Bob | $100 |
So, by extension →
| Debtor | Creditor | Amount |
|---|---|---|
Alice | Bob | 100 |
Bob | Charlie | 80 |
Charlie | Alice | 70 |
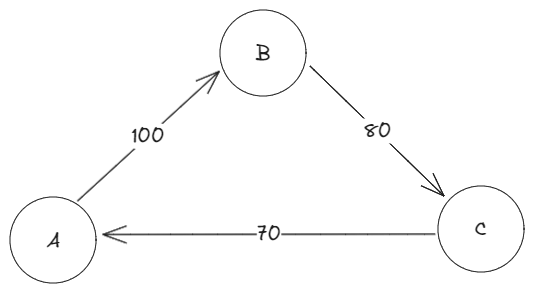
Turns out we’re dealing with a graph and that makes it way easier to find cycles as there are highly optimized algorithms available for this purpose. But it still isn’t clear how we can maximize liquidity savings.
Some important observations
Let’s take a closer look at our example graph and make some observations.
Notice that some users have an excess of liquidity whereas others are in deficit.
- For e.g. only
Aliceowes more than she is owed. i.e.Aliceowes$100and is owed$70, so the difference is$30. BobandCharlieare both owed more than they owe others. (differences are$20and$10respectively).
The sum of positive net positions is equal to the sum of negative net positions (both being $30 in our case).
NID) of a network.Reduction to a max-flow problem
With these observations let’s take a step back and visualize the entire obligation graph.
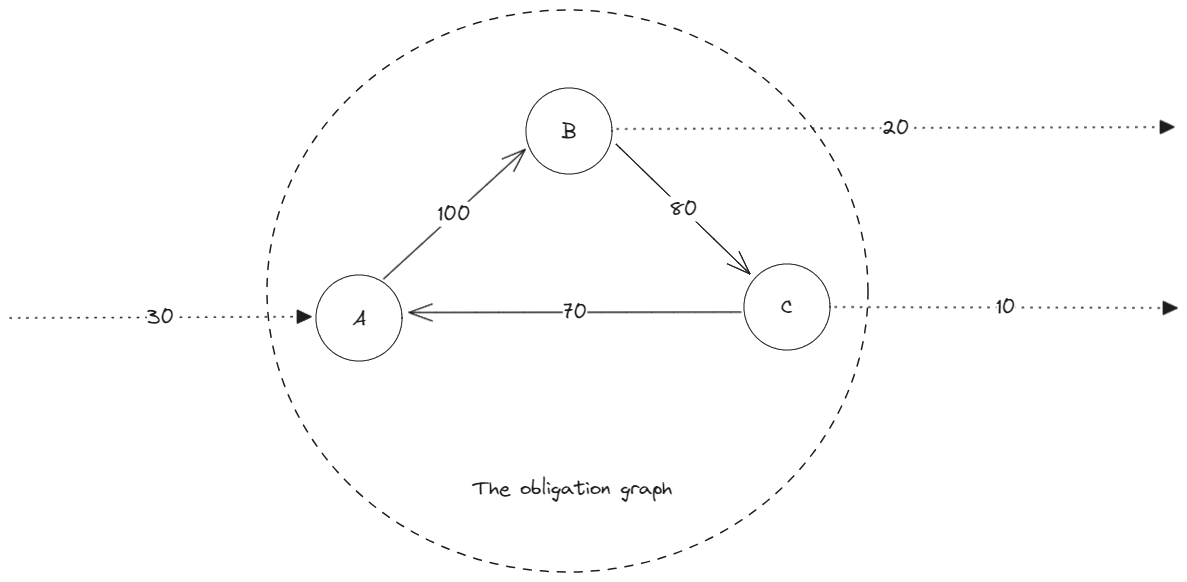
Notice that the NID is the real debt in the system. It is also the maximum amount of liquidity that can be pushed into the system. The additional dotted arrows are basically demonstrating the net positions of users in the graph. They are the excess and deficit liquidity coming into and going out of the graph.
Intuitively, the NID is all the liquidity that should be required for a network to clear all its obligations. In other words, if we were to route the NID through the obligation graph then the remaining obligations should clear themselves (i.e. the remaining obligations should be in cycles).
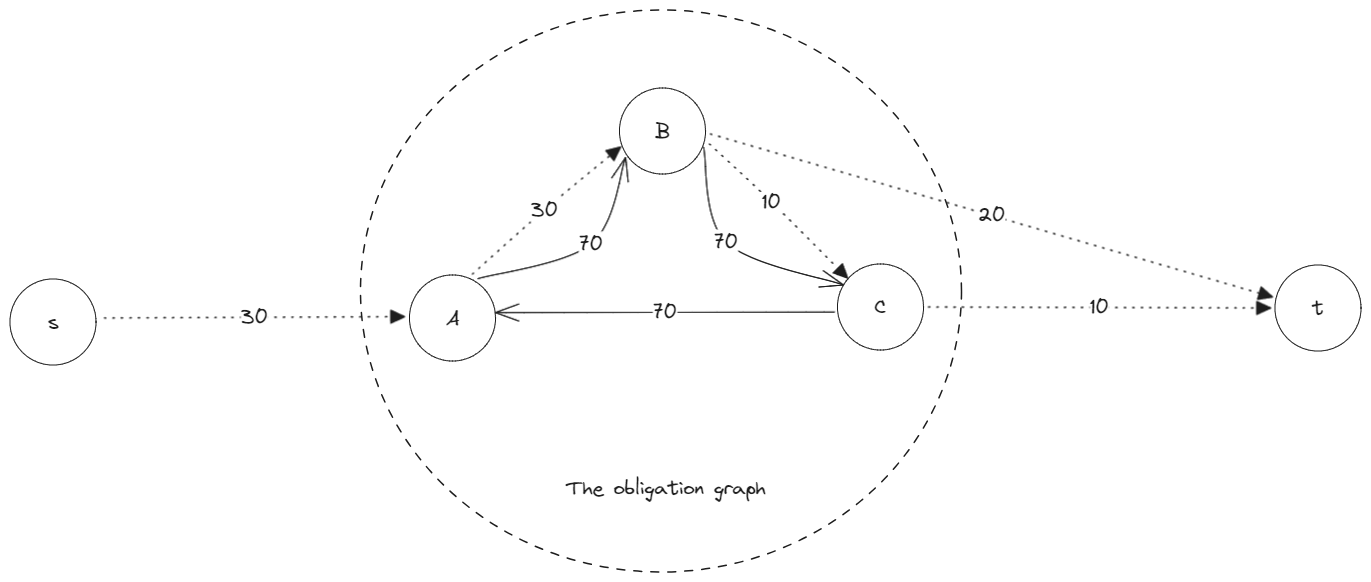
Is this a coincidence? Not really, this is a known lemma in network flows theory →
f on a network G into at most m cycles and s-t paths.Notice we introduced two imaginary nodes s and t - from the perspective of the graph, all that matters is that these arrows are coming from (or going) outside the graph and therefore these additional nodes should have no effect on the problem description.
So, we can now reframe our problem as follows →
Given a graph, how much flow can you push from s to t while respecting the following constraints →
- For any edge, flow (
f) cannot exceed its capacity. - For any node (except
sandt), the flow must be conserved (i.e.fin == fout).
Actually, that’s a well-known graph problem known as the max-flow problem!
Putting it all together
We can solve the obligation-clearing problem by →
- Balancing the graph so that it respects the flow conservation constraint. We do this by calculating the net position of each user and connecting them to either the source or sink depending on whether their net position was positive or negative.
- Running the max-flow algorithm over the balanced graph to route
NIDfromstot, to find the flow paths. - The remaining paths will be cycles consisting of (potentially reduced) obligations.